Sunday, October 6, 2024
Introduction to Graph Theory and Graph Neural Networks (GNNs)

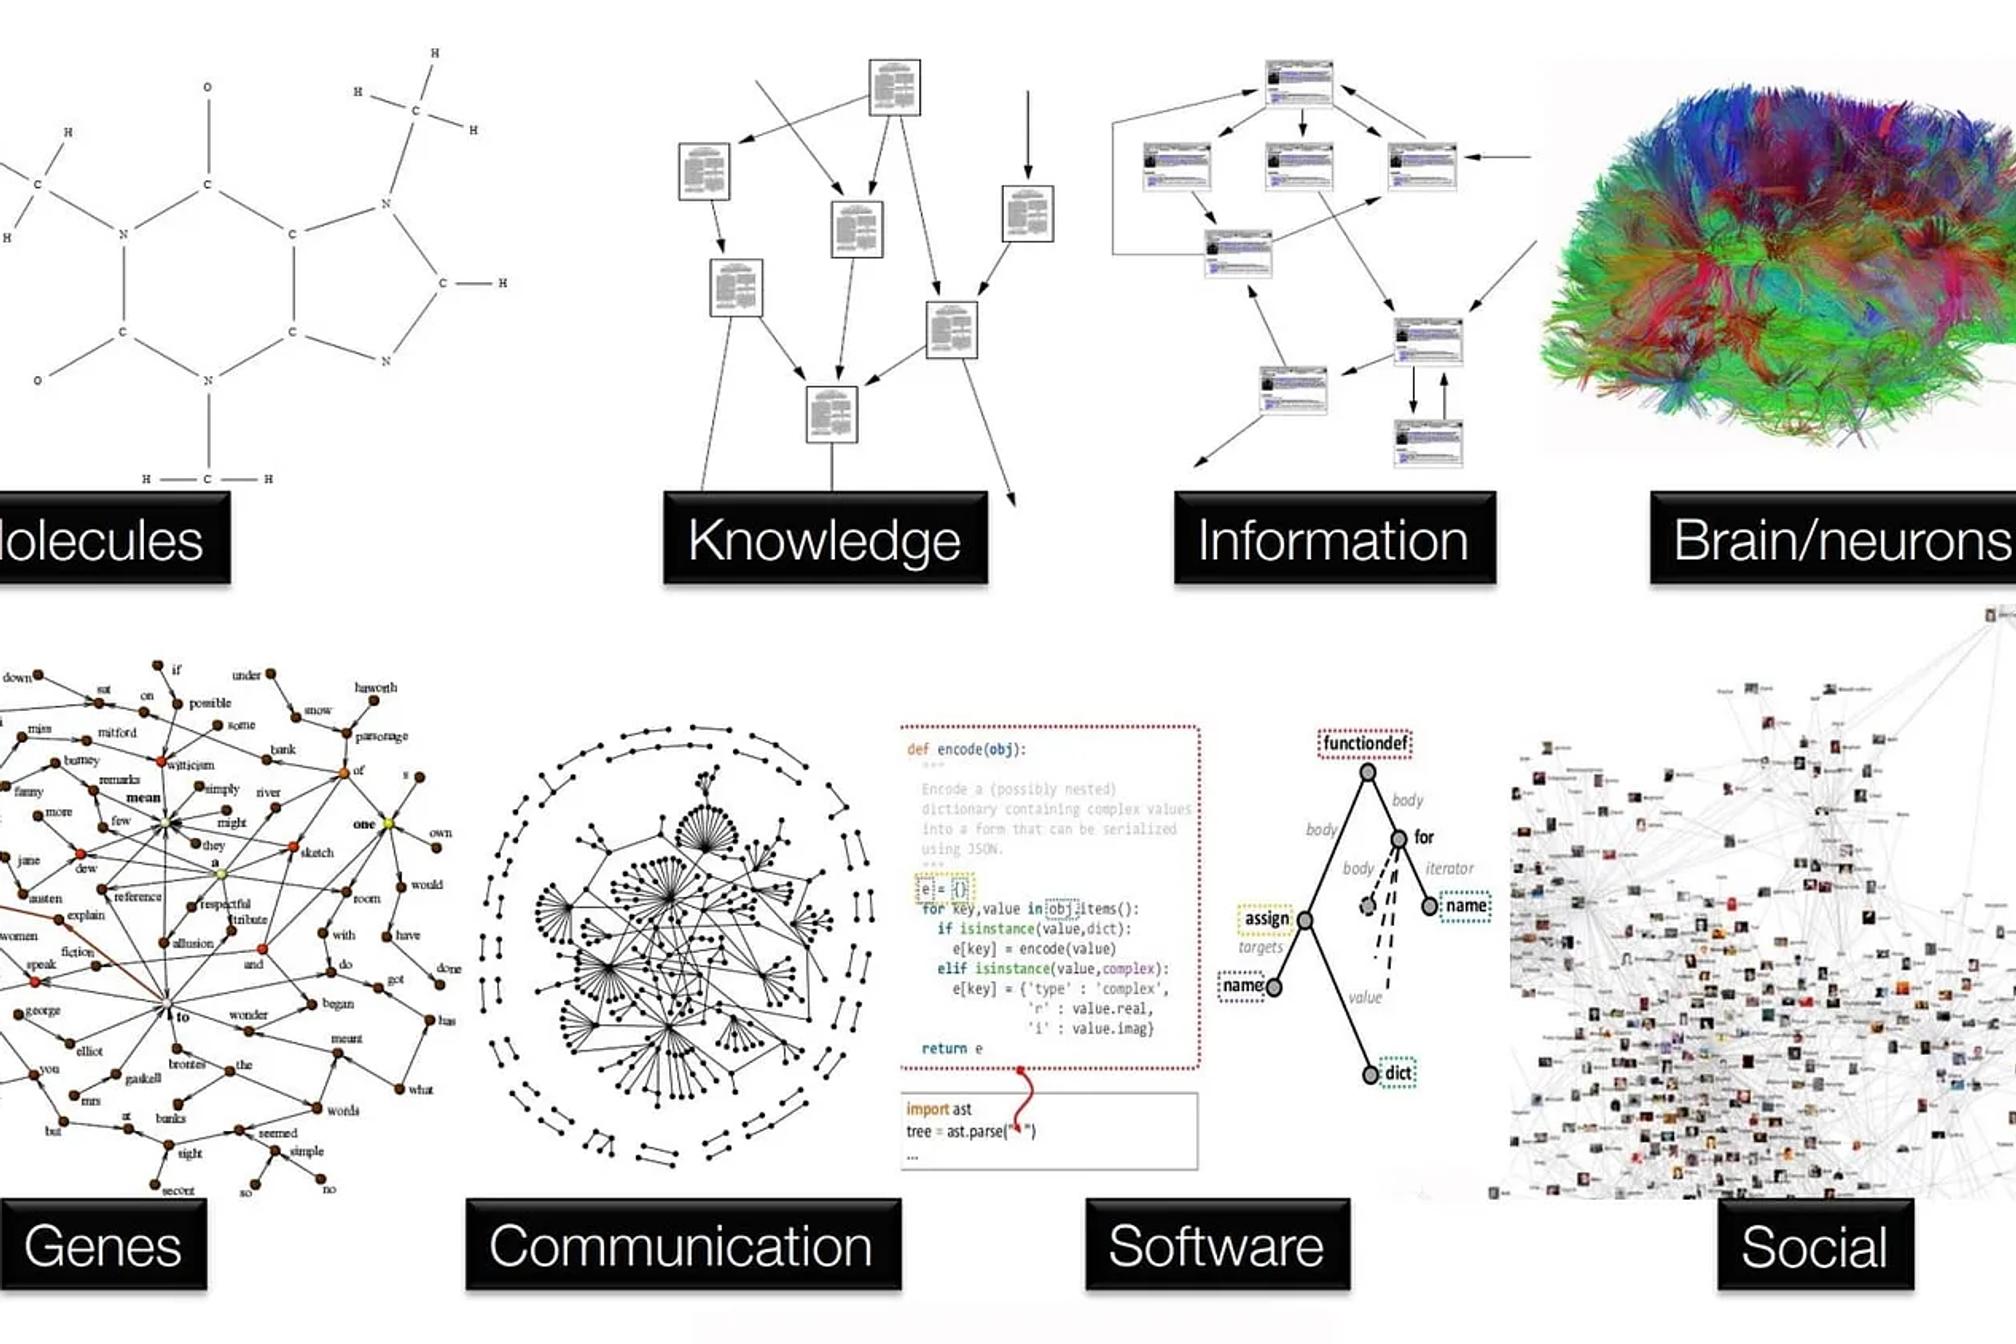
Graphs are powerful tools for representing and analysing complex relationships in data. By converting real-world data into graphs, we can uncover patterns and insights that are often hidden in raw datasets. In this blog, we’ll explore the basics of graph theory, its applications in various domains, the common formats and datasets used in graph analysis, and how graphs are utilized in machine learning, particularly with Graph Neural Networks (GNNs).
1. Introduction to Graph Theory
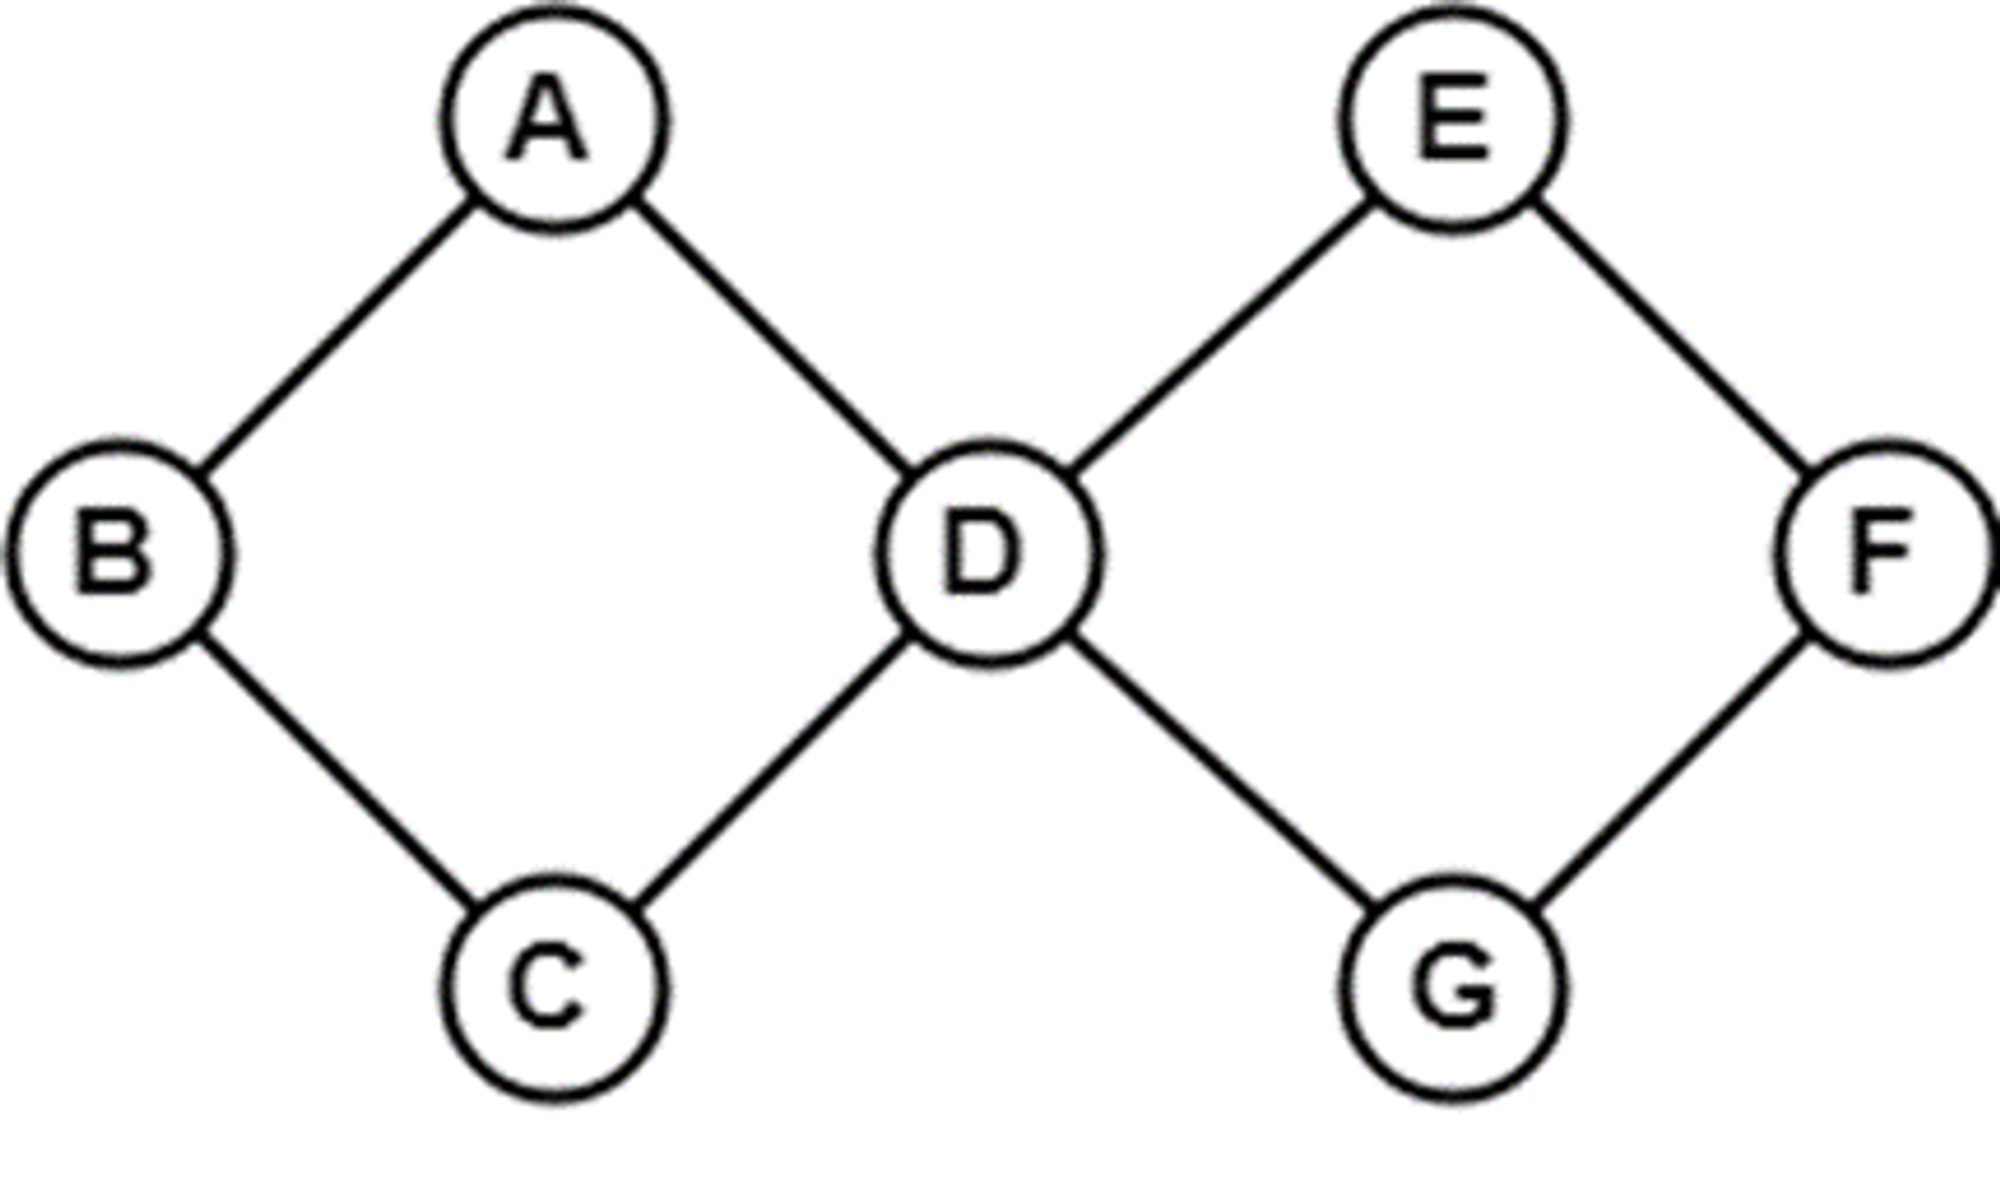
Graph theory is a fundamental branch of mathematics that focuses on the study of graphs, which are powerful tools used to model complex relationships between entities. A graph consists of two key components:
- Nodes (or vertices): These represent entities or objects in the system. For instance, in a social network, a node could represent an individual user.
- Edges (or links): These represent the connections or relationships between nodes. In a social network, an edge could signify a friendship or a follow between two users.
Graphs are primarily used to model systems where the relationships between entities are just as important as the entities themselves. Depending on the type of data, graphs can be classified into two broad categories:
- Directed graphs: In a directed graph, edges have a specific direction, indicating a one-way relationship between nodes. For instance, on Twitter, a follow is a directed relationship, as one user follows another, but the reverse may not hold true.
- Undirected graphs: In an undirected graph, edges have no direction, indicating mutual relationships. For example, on Facebook, a friendship is a mutual connection where both users share the same relationship.
Real-World Applications of Graphs:
- Social Networks: In platforms like Facebook or LinkedIn, graphs represent users (nodes) and their friendships or connections (edges). Analyzing social networks helps identify influential individuals, detect community structures, and understand the spread of information.
- Molecular Structures: In chemistry, molecules can be represented as graphs where atoms are nodes, and bonds between them are edges. These molecular graphs play a crucial role in drug discovery, material design, and reaction prediction.
- Knowledge Graphs: Knowledge graphs are used to represent information with nodes as entities (e.g., people, places) and edges representing relationships between them (e.g., “born in” or “works at”). These graphs are essential for organizing large-scale knowledge in systems like search engines.
- Citation Networks: In academic research, papers can be represented as nodes, and citations between them as directed edges. Citation networks help trace the influence of research over time and identify seminal papers within a field.
Graph theory allows researchers to model these systems, revealing intricate patterns and insights that are often hidden in raw datasets.
2. Implementing Graphs on Real-World Data
Graphs are ubiquitous in various domains. Their versatility allows them to be applied to different fields, from social networks to biological structures. Let’s explore a few real-world examples where graphs are used extensively.
2.1 Social Networks
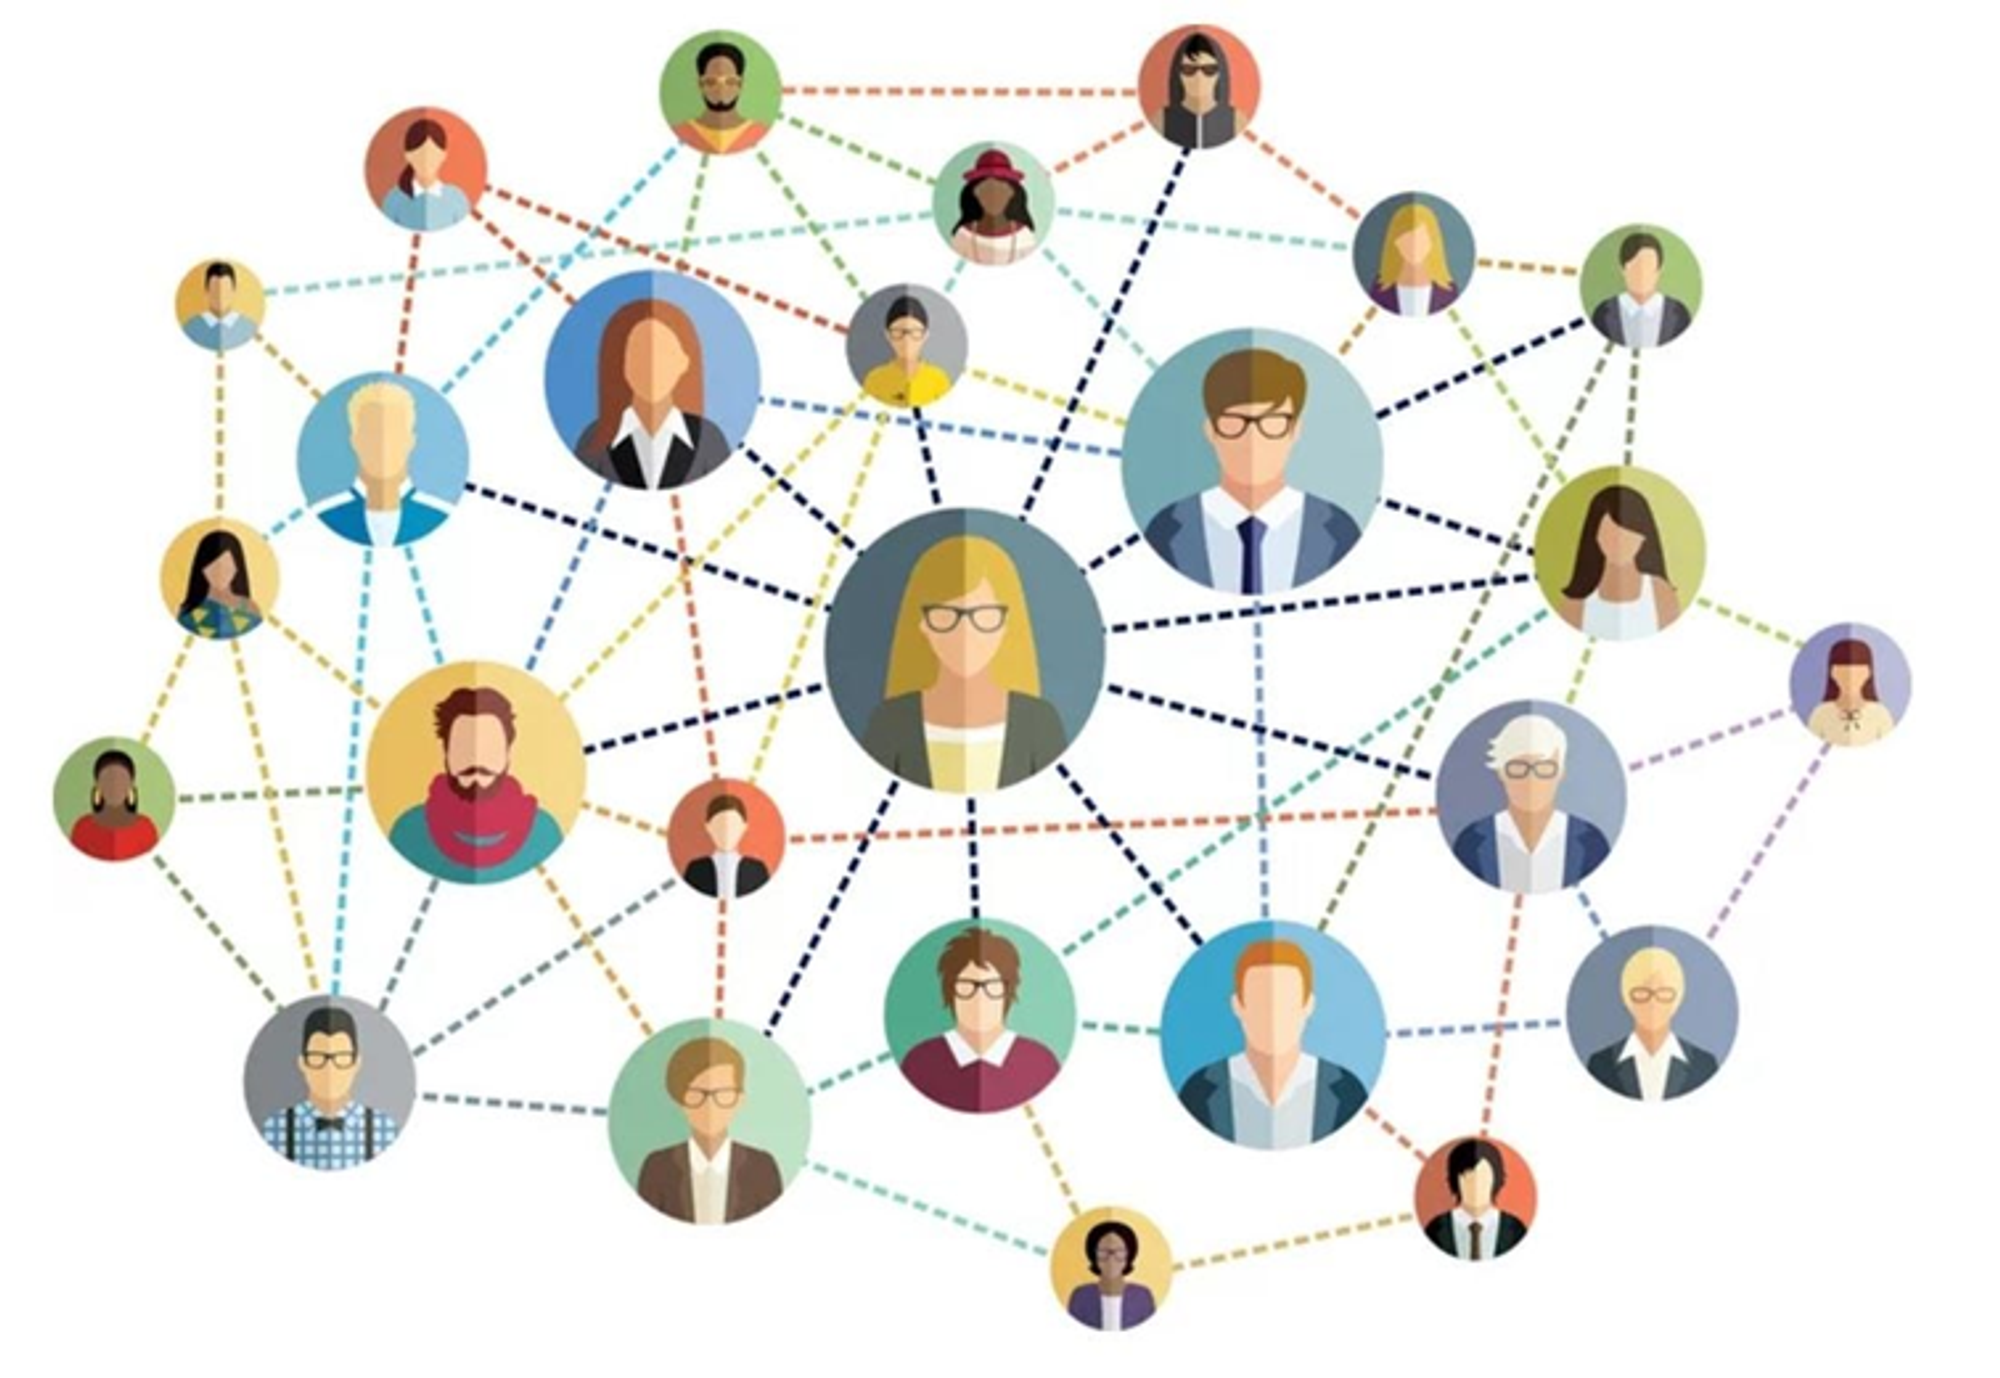
In social networks, graphs are a natural way to model interactions between users. Social media platforms like Facebook, Twitter, and LinkedIn can be represented as graphs where:
- Nodes: Represent individual users.
- Edges: Represent interactions such as friendships, follows, or messages.
For instance, on Facebook, if two users are friends, there will be an undirected edge between their nodes. If one user follows another on Twitter, there will be a directed edge from the follower to the followed.
Analyzing these social graphs can provide key insights into the structure of the network. Community detection algorithms, like the Louvain method or the Girvan-Newman algorithm, can identify clusters of tightly connected users who frequently interact with each other. This analysis helps uncover the social dynamics, identify influencers, and understand how information spreads in a network. Visualization tools such as Gephi or NetworkX allow researchers to generate visual representations of these graphs, offering a more intuitive way to study social interactions.
2.2 Molecular Structures
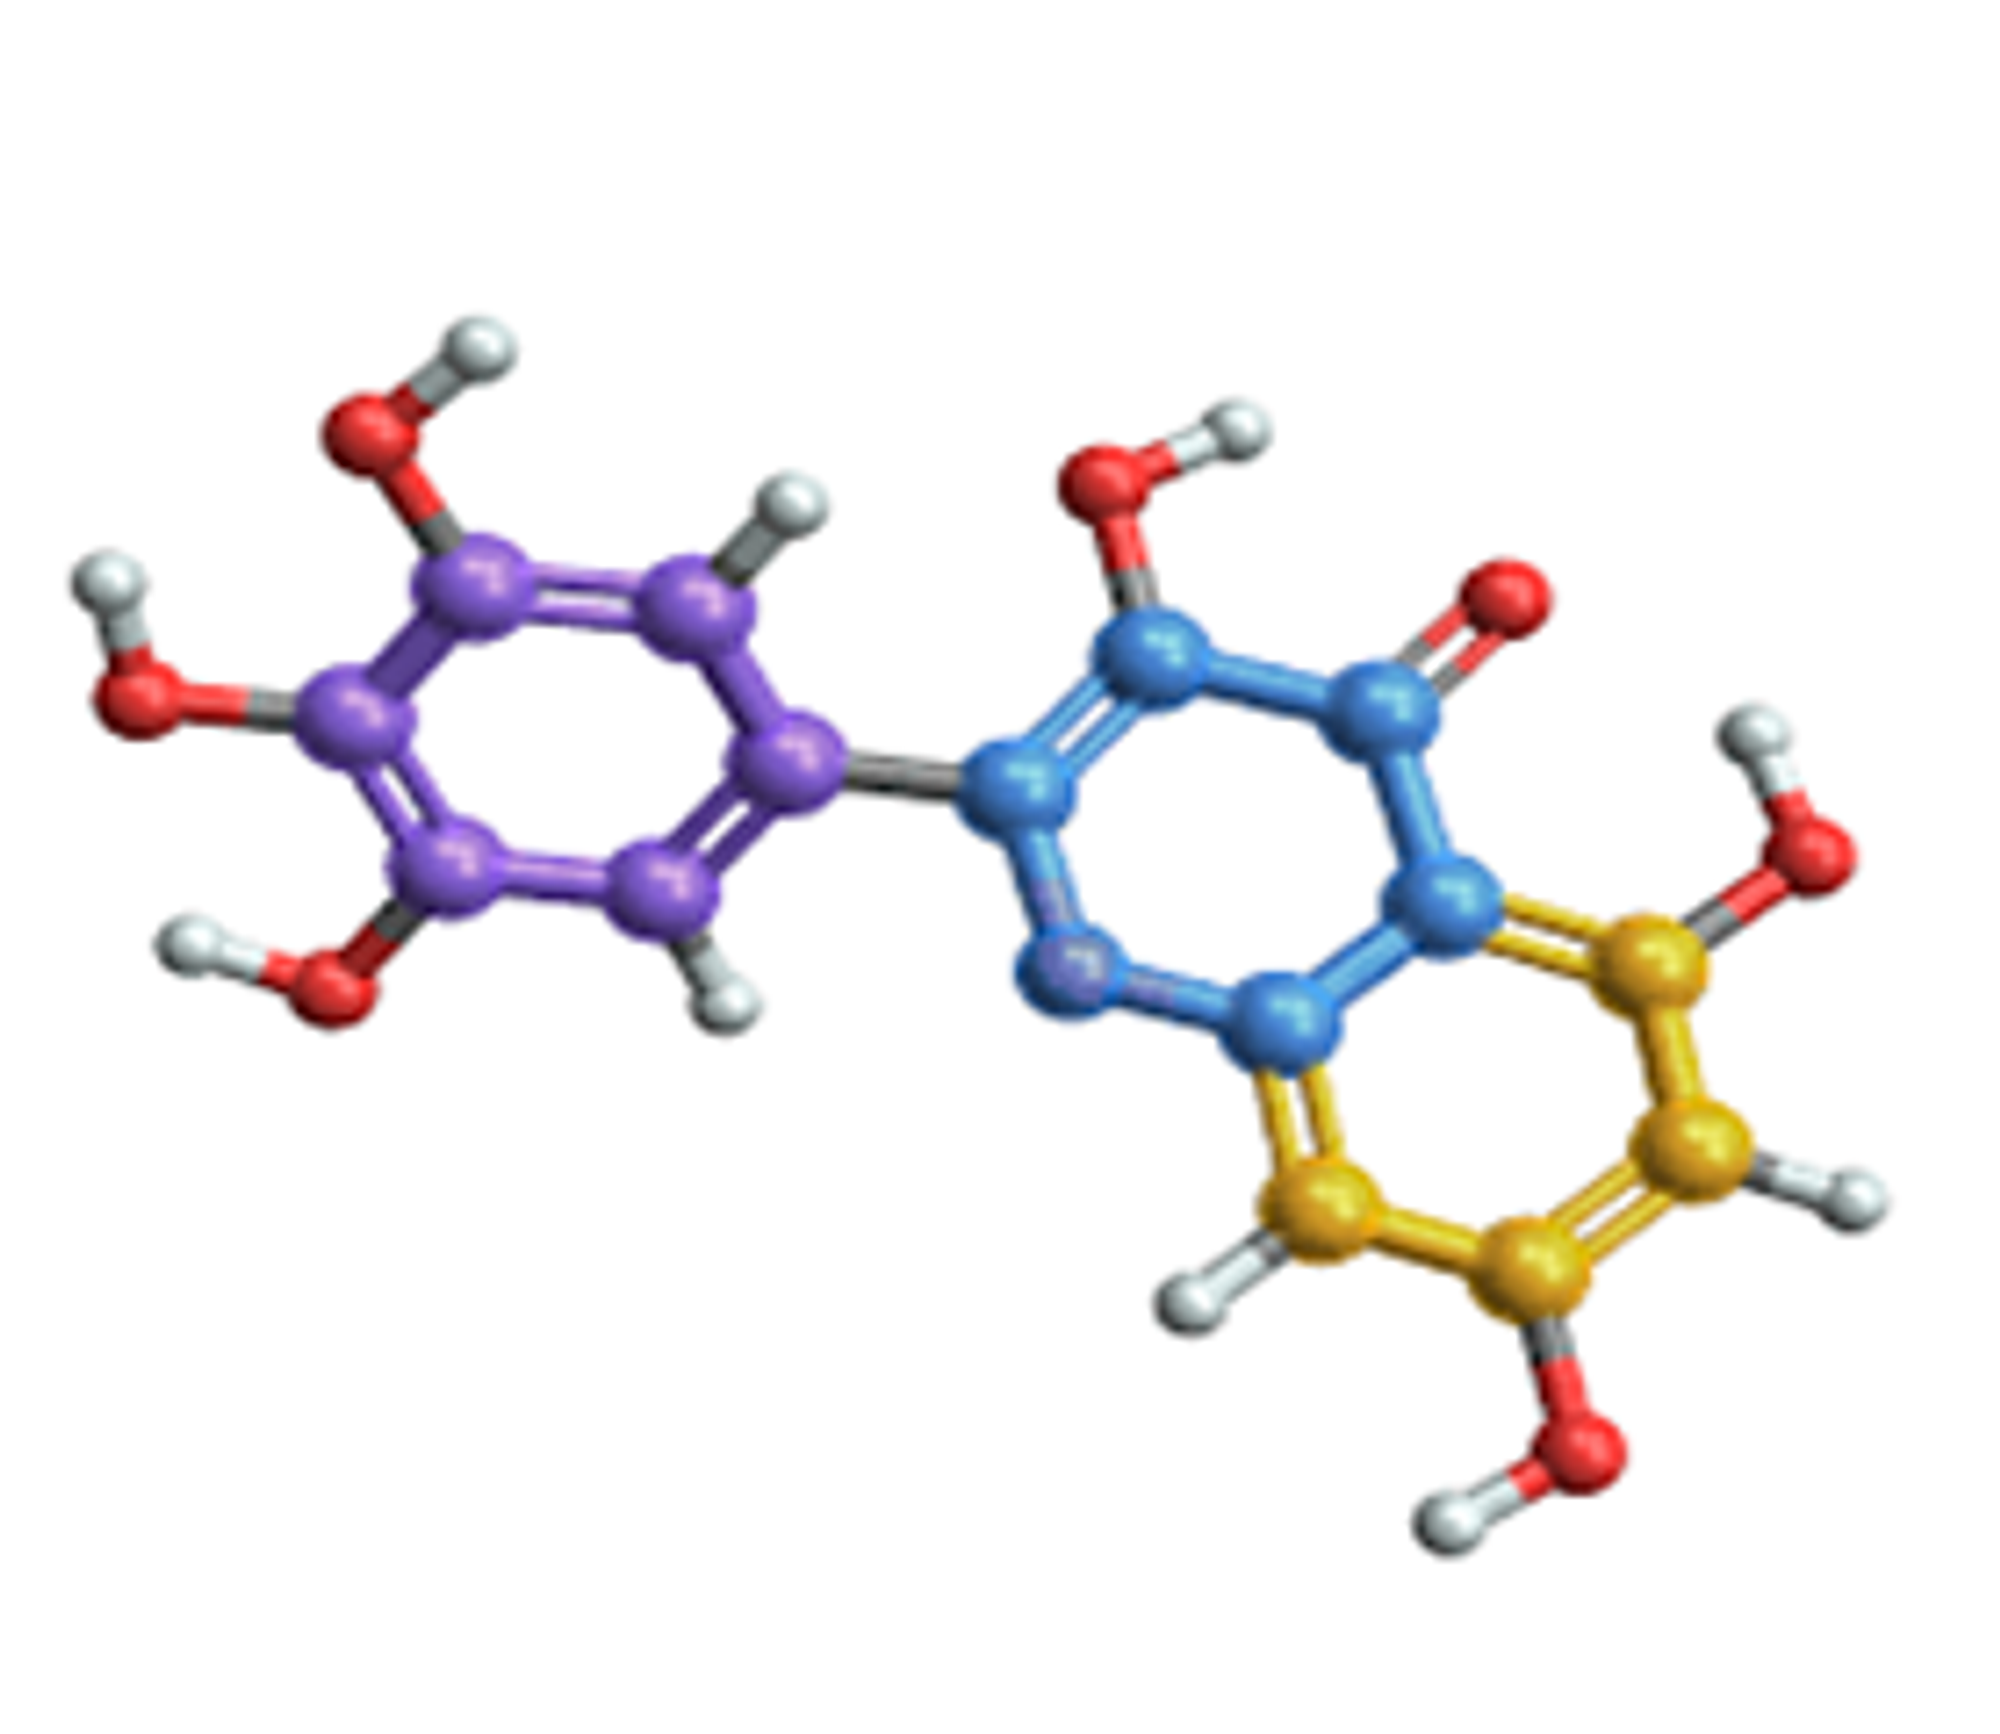
Molecular graphs are essential in chemistry and drug discovery. In molecular graphs:
- Nodes represent atoms.
- Edges represent chemical bonds between atoms.
For example, a simple molecule like water (H₂O) can be represented as a graph with three nodes (two hydrogen atoms and one oxygen atom) and two edges (the bonds between hydrogen and oxygen). This graphical representation helps scientists visualize molecular connectivity, which directly influences the molecule’s properties and behaviors.
Molecular graphs are widely used in drug discovery. By analyzing the structure of potential drug candidates and their interactions with biological targets, researchers can predict how effective a drug might be. Tools like RDKit and Open Babel are used to create and analyze molecular graphs, allowing scientists to simulate chemical reactions and design new compounds with desired properties.
2.3 Knowledge Graphs
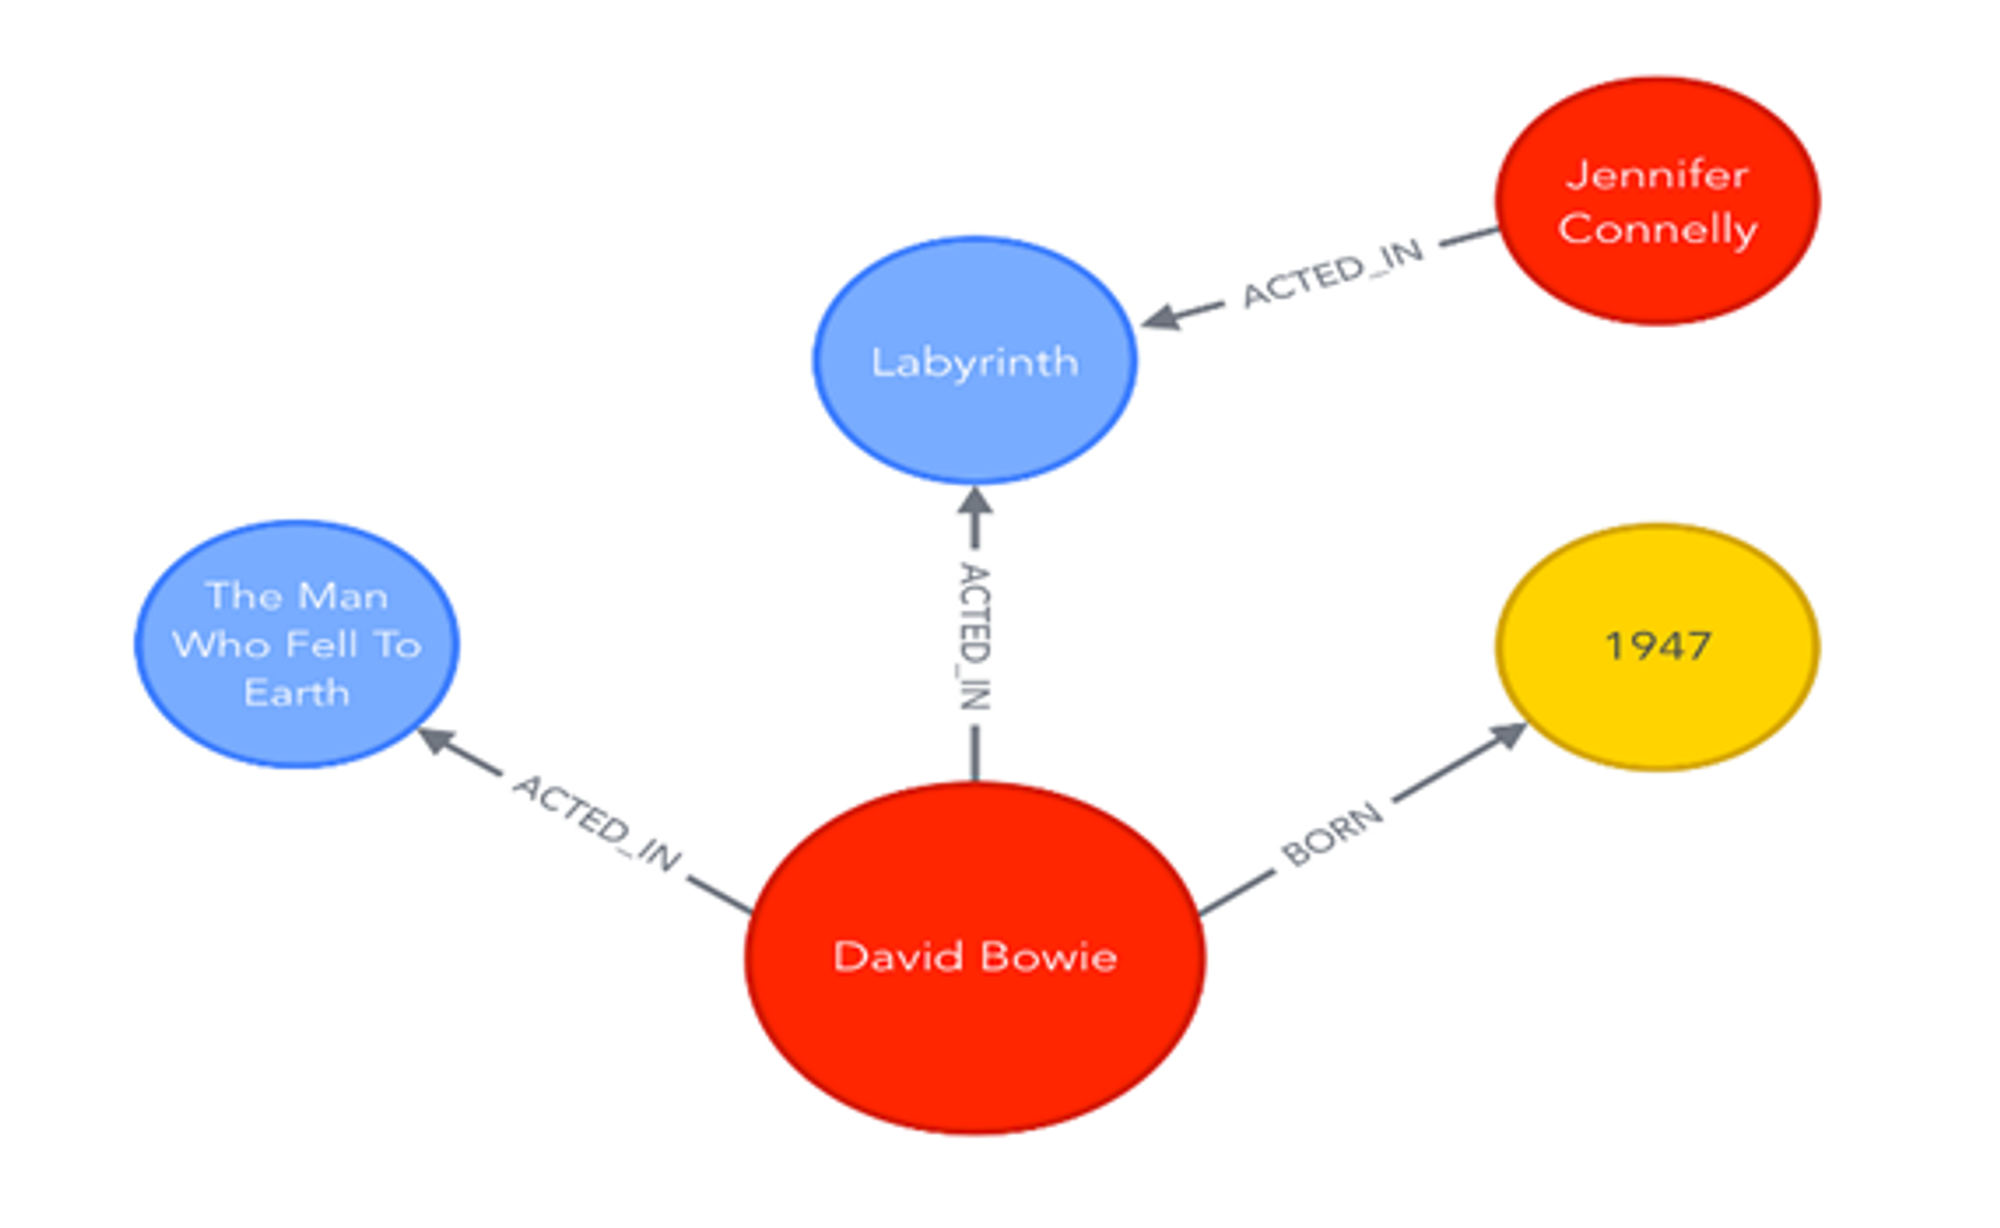
A knowledge graph represents entities (such as people, organizations, or concepts) and their relationships in a structured format. In a knowledge graph, nodes are entities, and edges define how these entities are related.
For example, in a knowledge graph about literature, the book “1984” might be linked to George Orwell (the author) and to its publisher. These graphs are useful for information retrieval systems like search engines, as they help understand the context and relationships between search queries, improving the relevance of results.
Building a knowledge graph involves extracting entities and relationships from various sources like databases, websites, and text documents. Frameworks like RDF (Resource Description Framework) and OWL (Web Ontology Language) are commonly used to represent and query these graphs. Tools like SPARQL can be used to query knowledge graphs to retrieve specific information. Prominent examples of large-scale knowledge graphs include Google’s Knowledge Graph and Microsoft’s Concept Graph.
2.4 Citation Networks
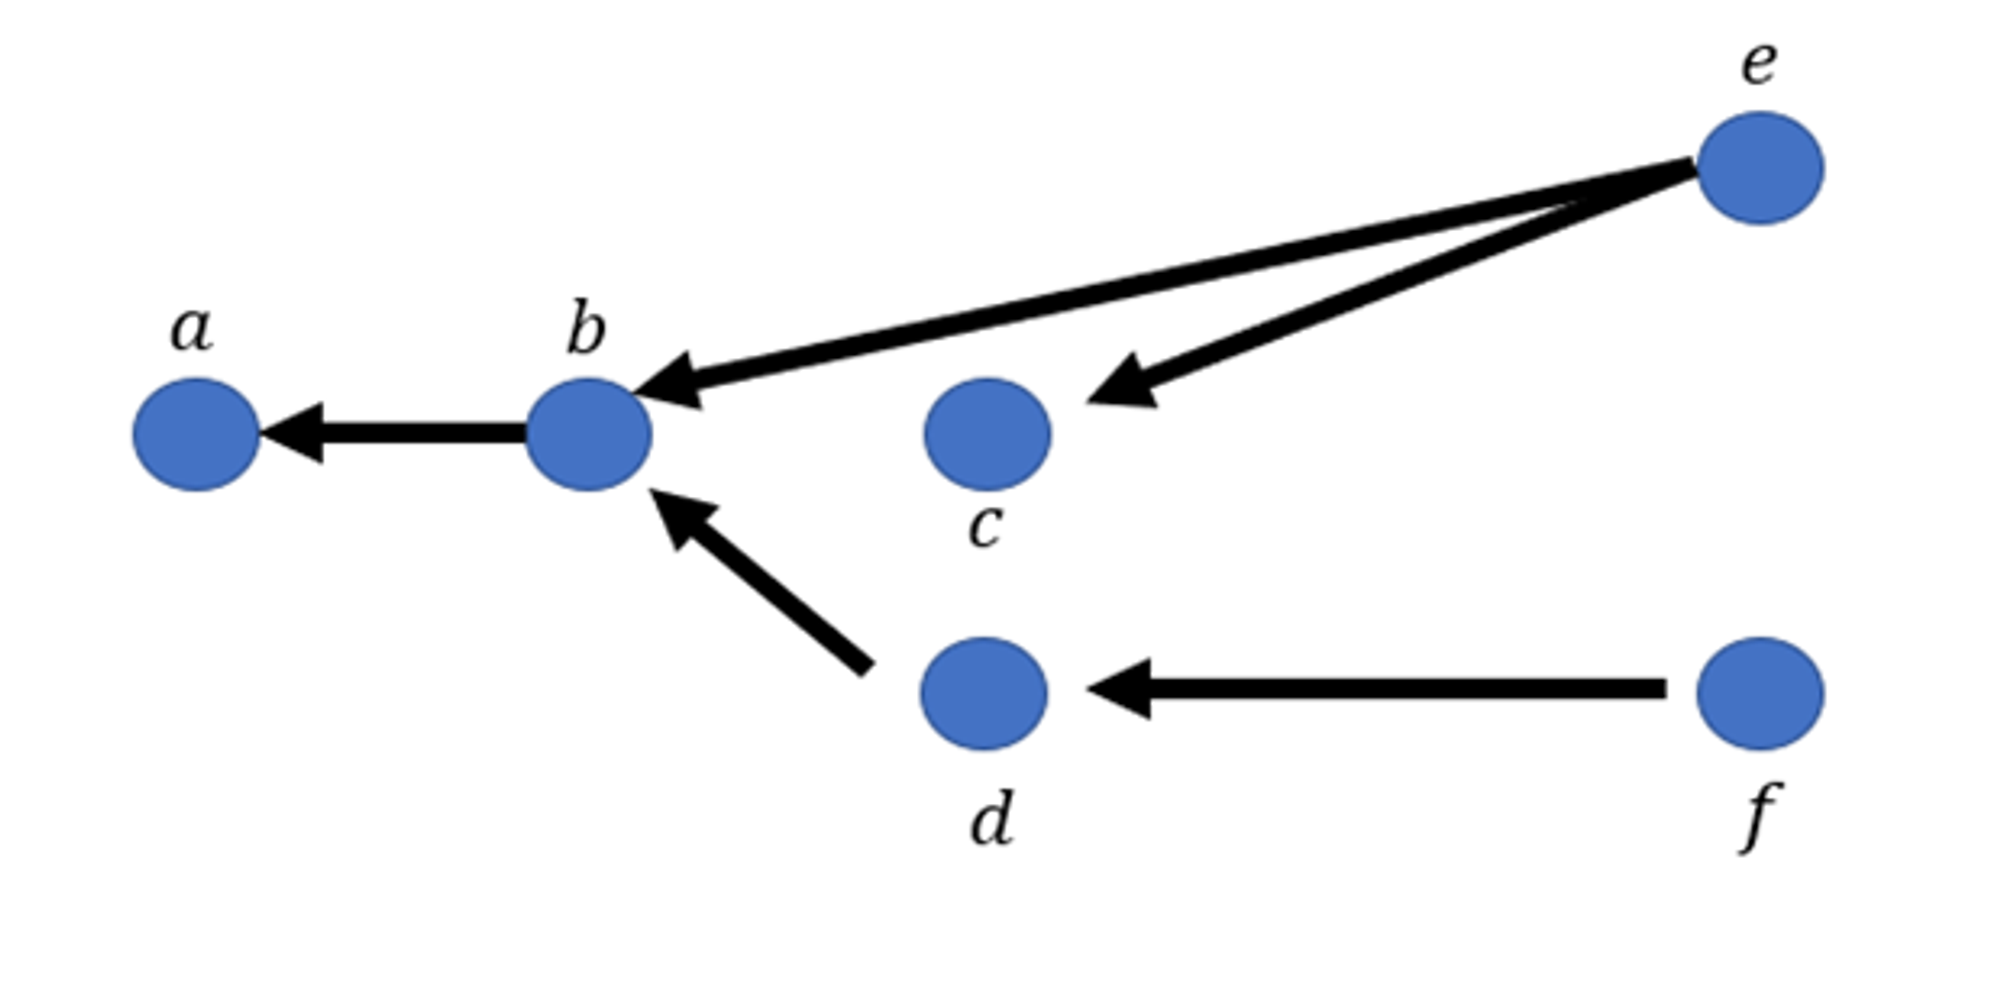
Citation networks are graphical representations of academic literature, where each node represents a research paper, and an edge indicates a citation from one paper to another. This type of graph is essential for understanding the structure and dynamics of scientific research, tracing the development of ideas, and identifying influential works.In a citation network:
- Nodes represent research papers.
- Edges represent citations between papers.
If Paper A cites Paper B, there is a directed edge from Paper A to Paper B. Citation networks allow researchers to track the development of ideas and trace the influence of seminal papers. Metrics like h-index or impact factor are often derived from citation networks to measure the influence of authors and papers.
By analyzing these networks, it is possible to identify influential works, emerging trends, and important research fields. Tools like CiteSpace and VOSviewer are used to visualize and analyze citation networks, revealing patterns in how scientific ideas evolve over time.
3. Common Graph Data Formats and Standards
Graph data can be stored and exchanged in several standard formats, including:
- GraphML: An XML-based format that stores graph structures and attributes.
- GEXF (Graph Exchange XML Format): Designed for visualizing graphs, this format allows the representation of complex network data.
- JSON for Graphs: A JSON-based format often used for web applications to integrate graph data with web technologies.
Common Graph Datasets
Several datasets are commonly used in graph analysis and research:
- Cora: A dataset of scientific publications in machine learning, containing information on the papers and their citation relationships.
- PubMed: A dataset of biomedical literature, often used in citation network analysis and bioinformatics research.
- PROTEINS: A dataset representing protein structures, used in bioinformatics to study the properties and interactions of proteins.
4. Graph Neural Networks (GNNs)
As graph data becomes more prevalent, machine learning models that can work on graphs have gained importance. This is where Graph Neural Networks (GNNs) come in. Unlike traditional neural networks that operate on grid-like data (such as images or text), GNNs are designed to handle graph-structured data, allowing them to leverage the relationships between entities as well as the properties of individual nodes and edges.
4.1 How GNNs Work
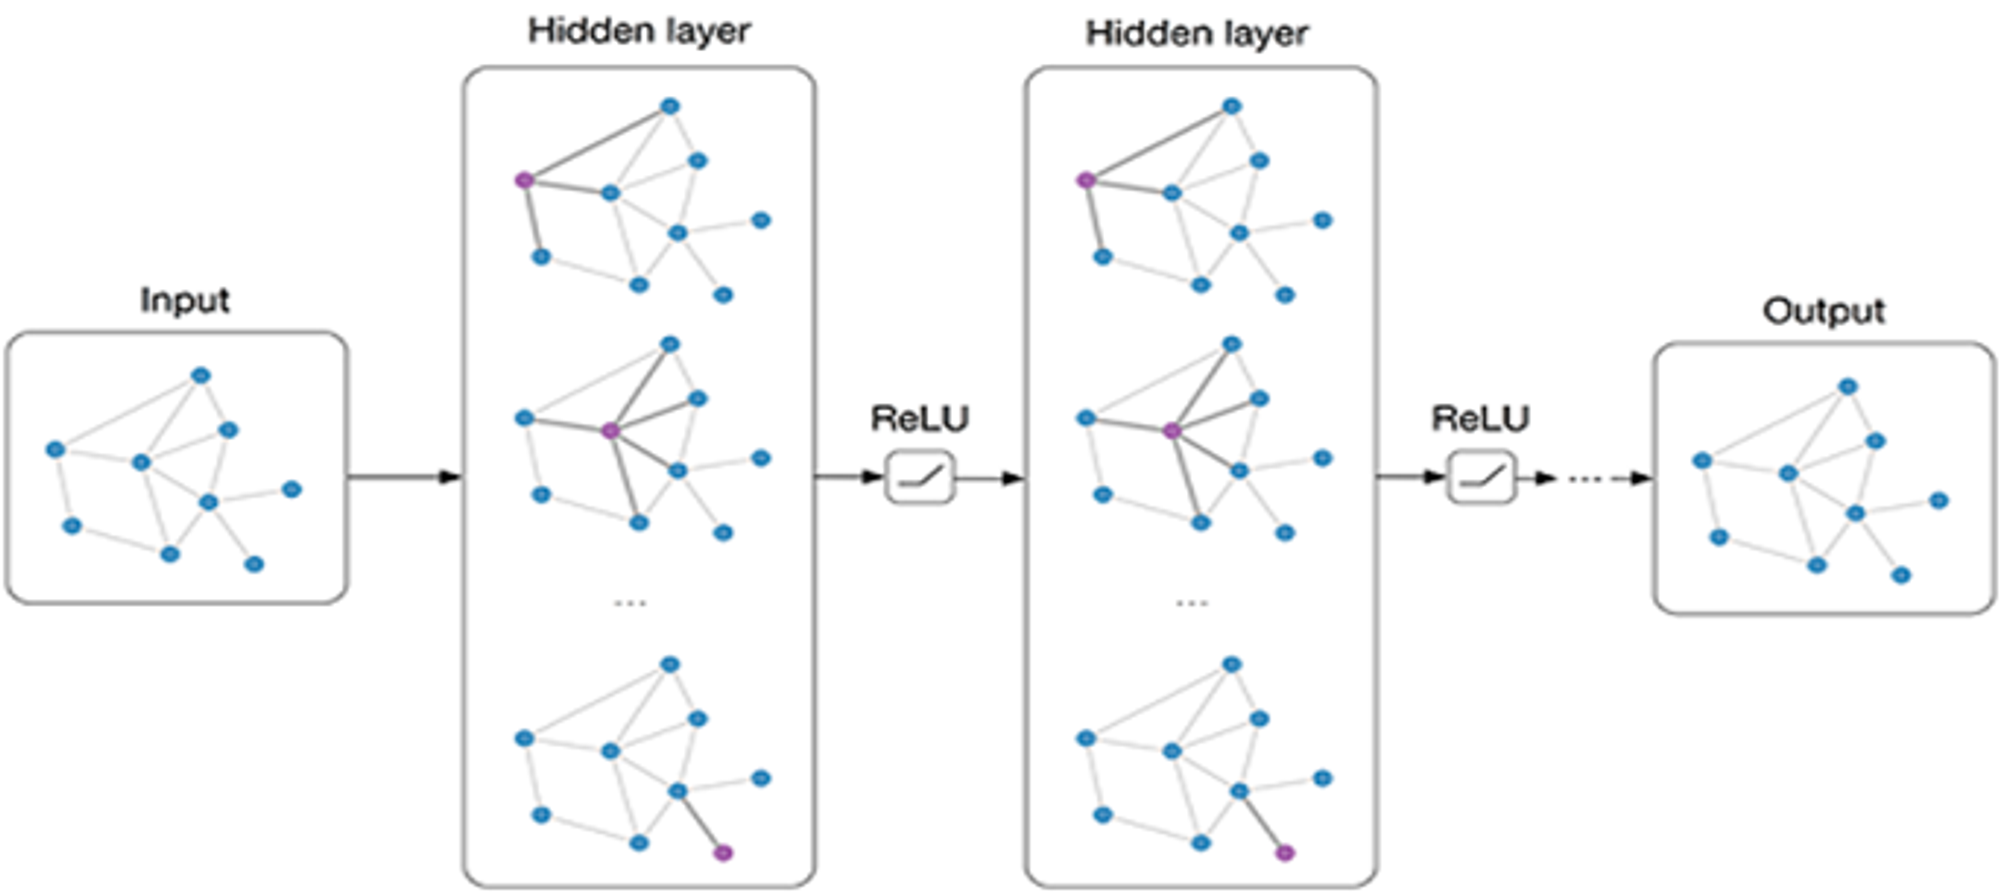
GNNs operate by performing a process called message passing, where nodes exchange information with their neighbors to update their own features. This process enables GNNs to learn rich representations of both nodes and edges, capturing both local and global graph structures.
The general workflow of a GNN includes:
- Node Features: Each node is initialized with a set of features representing its attributes. For instance, in a molecular graph, node features could represent atomic properties such as element type and charge.
- Edge Features: Each edge can also have features representing the relationship between the connected nodes, such as bond type in molecular graphs.
- Message Passing: Nodes aggregate information from their neighbors, updating their features based on the structure of the graph. This process is repeated over several layers, allowing nodes to capture higher-order relationships.
- Output: After message passing, the updated node and edge features can be used for tasks such as node classification, link prediction, or graph classification.
GNNs are widely used in applications like social network analysis, recommendation systems, and biological data analysis, as they excel at capturing relational data.
4.2 GNN Models
Several types of GNN models have been developed to handle different tasks:
- Graph Convolutional Networks (GCNs): These apply a convolutional operation to graph data, allowing nodes to aggregate features from their neighbors in a structured way.
- Graph Attention Networks (GATs): These use attention mechanisms to weight the importance of different neighboring nodes, allowing more flexible information aggregation.
- GraphSAGE: This method allows for efficient node sampling and aggregation, making it scalable to very large graphs.
GNNs have revolutionized graph-based machine learning by effectively incorporating the complex relationships found in graph data into predictive models.